Kubernetes is often self-healing. Containers will restart, operators will continuously try to apply the desired state, but there might be things you want to know about, and things that can’t be solved automatically.
You probably also do care about things like the performance over time, and bottlenecks in your system, and maybe you wants some nice graph so you can visually see how your cluster behaves over time? There’s solutions for those things.
I’ve been working on this for a while, and monitoring covers a lot of things, so this is going to be a long post! Stay tuned! Also, a bit of this operator config is a bit hard to get correct, with labels and selectors. I hope I don’t forget anything 😀
Prometheus – collecting metrics
The defacto standard for metrics collection, and not only in Kubernetes, is prometheus.
Prometheus stores time-series with metrics that it collects from various sources. You configure through scrape configs what components it should collect metrics from. A lot of software, and especially those meant to be run in container environments, will expose prometheus metrics on a dedicated endpoint. In other cases, there might exist add-on-software that will provide those metrics endpoints and translate that to i.e. internal APIs etc.
For simplicity, you might want to run your whole monitoring stack in the same namespace. In my case, I named it grafana, as that was what I was aiming to run at the start, but a better name would have been monitoring.
Grafana – visualizing metrics
Where Prometheus is the standard for collecting metrics, grafana is probably the most common way to create dashboards to visualize the metrics.
You can create dashboards with prometheus metrics, but you’re not limited to kubernetes metrics, you can use other kinds of data too. I have so far stuck to prometheus, though.
Installing Prometheus and Grafana
I like the custom resource way of configuring things in Kubernetes. You can do that with prometheus and grafana. I decided to install them both in one go with Kube-prometheus-stack, which has a helm chart.
Whenever I install something with helm, I usually inspect what kind of options I can tune.
In this case, I basically did the following:
- Enable grafana
- Enable alertmanager
- Enable prometheus
- Enable prometheus operator
- Turn on standard prometheus metrics for cluster components that was built into the helm chart
- Tune a few settings (like how often prometheus should poll metrics. I have tuned that down a bit. I’m not running exactly mission criticial stuff.
What I didn’t get was grafana-operator. I decided to still install grafana through kube-prometheus-stack, but install grafana-operator from bitnami. I can have grafana-operator manage an already installed grafana, so I’m good there.
I also set up ingressroutes for all of this, and external-dns etc so that I can access it through https://prometheus.example.com/, https://grafana.example.com/ and https://altermanager.example.com/
So, let’s look at a practical example. Let’s say I want to monitor my externaldns.
Prometheus
prometheus-operator basically lets you manage prometheus with kubernetes resources. I kind of like this instead of configuring it all manually or in configuration files. This way, I can have the configuration for what prometheus should scrape from a kubernetes installed workload together with the workload, in custom resources.
I do need something to scrape, though. ExternalDNS exposes metrics on a port named http, so I’ll have to create a ServiceMonitor resource to tell Prometheus to scrape it.
apiVersion: monitoring.coreos.com/v1
kind: ServiceMonitor
metadata:
  name: externaldns
  namespace: externaldns
  labels:
    release: kube-prometheus-stack
spec:
  selector:
    matchLabels:
      app.kubernetes.io/name: external-dns
  namespaceSelector:
    matchNames:
    - externaldns
  endpoints:
  - port: http
The label release: kube-prometheus-stack is a label that prometheus-operator is configured to watch for.
This basically tells promtheus to scrape this path on the http port of external-dns – i.e. no separate metrics port. A lot of component out there would expose metrics on a dedicated port, especially if they expose HTTP on another port. External-dns, however, isn’t a web app, so this is the only http endpoint in here.
With metrics there, we can go into prometheus and look up:
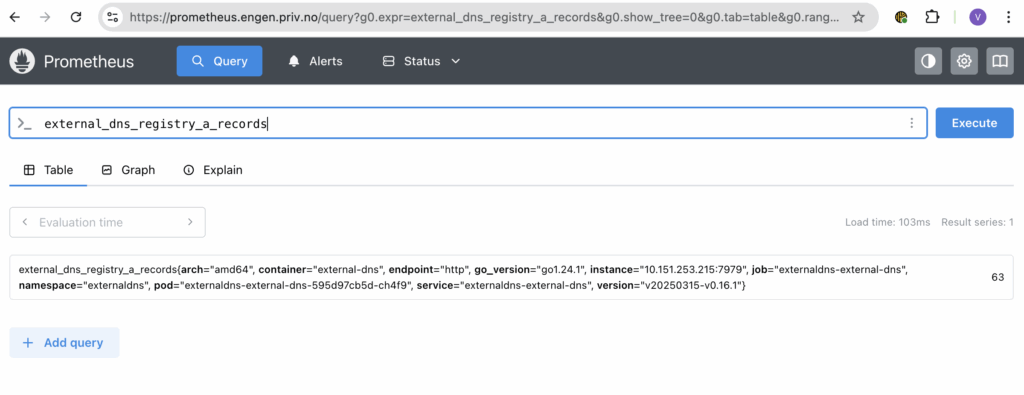
In prometheus, we can browse and search for the metrics, but you would want something that presents this, and perhaps you also want some alerting to alert you if things go haywire? You can configure all of this with the kube-prometheus-stack (and grafana-operator for provisioning dashboards)
Grafana
So, I’ll want a dashboard. There’s a pretty decent repository of pre-made dashbords on https://grafana.com/grafana/dashboards/, so I’ll go look for one for external-dns. There exists one at https://grafana.com/grafana/dashboards/15038-external-dns/, so we’ll go install that one.
I want to manage this through grafana-operator, which I have installed. This means I need to tell grafana-operator about my grafana instance:
kind: Grafana
metadata:
  name: grafana
  namespace: grafana
  labels:
    dashboards: "grafana"
spec:
  client:
    timeout: 5
  external:
    url: http://kube-prometheus-stack-grafana.grafana.svc.cluster.local:80
    adminUser:
      name: kube-prometheus-stack-grafana
      key: admin-user
    adminPassword:
      name: kube-prometheus-stack-grafana
      key: admin-password
This little snippets tells grafana-operator that there is a grafana at http://kube-prometheus-stack-grafana.grafana.svc.cluster.local:80 (internal service name) . It also gives it an admin-user and admin-password through which it can manage it.
I have also told it to label it dashboards: grafana, so any resources I want grafana-operator to apply, I’ll have to provide this label to the matchLabels field.
So, let’s apply the dashboard:
kind: GrafanaDashboard
metadata:
  name: externaldns
  namespace: grafana
spec:
  resyncPeriod: 30s
  instanceSelector:
    matchLabels:
      dashboards: "grafana"
  folder: network
  url: https://grafana.com/api/dashboards/15038/revisions/latest/download
  datasources:
    - inputName: DS_PROMETHEUS
      datasourceName: Prometheus
Eureka! Now, there should be a grafana dashboard for external-dns under the network folder.
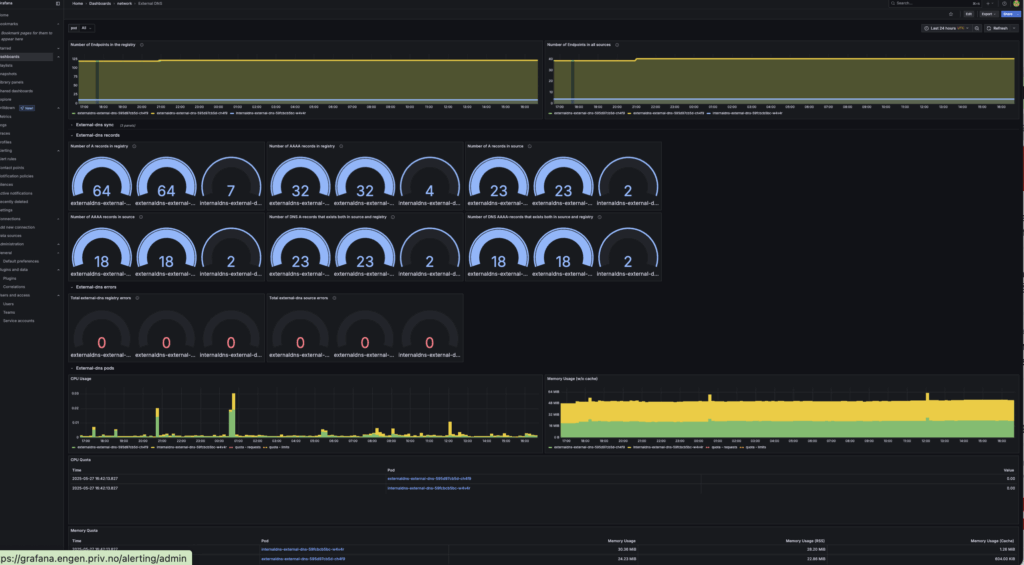
You can also provision a whole dashboard with adding json by providing the json in the field json instead of the url field.
Alerts
But, I’d also like some alerts if things go haywire, and here’s where prometheus rules and alertmanager comes in.
With prometheus rules, you can create alerts that exists in prometheus, but they’re not actually sent anywhere unless you have alertmanager sending it.
I decide to send alerts to slack. You can create a fully functional slack workspace free of charge, though with some limitation regards to history etc. I decided it’s good enough for me.
I’ll not go through creating a slack workspace or a webhook to send alerts to slack, but once this is done, there will be an URL we can call that will allow slack notifications to be sent. We need to create a secret with this url, as you’d likely want to keep it a bit secret:
apiVersion: v1
kind: Secret
metadata:
  name: alertmanager-slack-config
  namespace: grafana
stringData:
  slack_url: "https://hooks.slack.com/services/XXXXXXXX/YYYYYYYY/zzzzzzzzzzzzzzzz"
THen I need an alertmanagerconfig:
apiVersion: monitoring.coreos.com/v1alpha1
kind: AlertmanagerConfig
metadata:
  name: slack-config
  namespace: grafana
  labels:
    release: kube-prometheus-stack
spec:
  # externalUrl: "https://alertmanager.example.com"
  route:
    receiver: 'slack'
    groupBy: ['alertname']
    groupWait: 30s
    groupInterval: 5m
    repeatInterval: 3h
    matchers:
      - name: severity
        matchType: =~
        value: warning|critical
      - name: namespace
        matchType: =~
        value: ".*"
  receivers:
    - name: 'slack'
      slackConfigs:
        - channel: '#prometheus-alerts'
          apiURL:
            name: alertmanager-slack-config
            key: slack_url
          sendResolved: true
          title: '{{ .CommonAnnotations.summary }}'
          text: |-
            *Alert:* {{ .CommonLabels.alertname }}
            *Severity:* {{ .CommonLabels.severity }}
            *Instance:* {{ .CommonLabels.instance }}
            *Description:* {{ .CommonAnnotations.description }}
This references the previously created slack webhook.
This is picked up by alertmanager because of this helm section:
alertmanager:
  enabled: true
  ......
  alertmanagerConfigSelector:
      matchLabels:
        release: kube-prometheus-stack
    alertmanagerConfigNamespaceSelector:
      matchLabels:
        alertmanagerconfig: enabled
Note: There might be details here I have forgotten, some of this is a bit hard to get right at first.
You can alert based on prometheus metrics that it’s collected, but there’s also ways to i.e. probe systems for liveness and alert based on that. I use Prometheus Blackbox exporter for that.
To create a probe, you»ll need a custom resource like this:
kind: Probe
metadata:
  name: wordpress-probe
  namespace: grafana
  labels:
    release: kube-prometheus-stack
spec:
  jobName: wordpress-http
  prober:
    url: blackbox-prometheus-blackbox-exporter.grafana.svc.cluster.local:9115
  targets:
    staticConfig:
      static:
        - http://wordpress.wordpress.svc.cluster.local
  module: http_2xx
This will basically tell Blackbox to poll the endpoint http://wordpress.wordpress.svc.cluster.local for 200 OK, and track metrics from that. It will give a metric probe_success that tells if the last probe succeeded or not.
I have installed Blackbox with the following extremely small helm values.yaml:
serviceMonitor:
  enabled: true
  selfMonitor:
    enabled: true
It will create a ServiceMonitor resource sure prometheus gets the metrics from it, and will expose metrics about Blackbox internals too. This setup will allow me to use probes for my monitoring system.
Logging: Loki and Promtail
In the Grafana ecosystem, there also exists a log management system called Loki. It typically stores logs in an S3 bucket. However, there exists S3-compatible alternatives you can run yourself, and Loki runs well with Minio. You can apparently also let Loki install it’s own embedded Minio, but as I don’t see it as unthinkable I’ll use it for something else once I have it, I have installed it separately.
I will not really cover the installation, it’s pretty straightforward with Helm.
But loki only indexes logs it gets – something also need to feed it logs. Here’s where Promtail comes in – however it seems it’s deprecated, so you’re better off with Grafana Alloy – something I didn’t see before I was writing this blog. Oh well, I guess I’ll replace it at some point….
With promtail it’s possible to tune what you want it to track. Having some performance issues, I tuned down log colllections a bit, but now I’m back to just throwing all my Kubernetes logs for Loki to index.
You can also configure it to inject logs from outside Kubernetes itself, but I haven’t done that so far.
You can add Loki as a datasource for Grafana:
kind: GrafanaDatasource
metadata:
  name: loki-datasource
  namespace: grafana  # Change to your namespace
spec:
  instanceSelector:
    matchLabels:
      dashboards:  grafana
  allowCrossNamespaceImport: true
  datasource:
    name: Loki
    type: loki
    access: proxy
    url: http://loki-gateway.loki.svc.cluster.local
    jsonData:
      httpMethod: GET
      timeInterval: "10s"
This will make it possible to use logs in Grafana dashboards and browse and search the logs from within Grafana. I find this pretty neat, myself.
Setting up monitoring rules
Having the stack in place, we can make sure we create alerts for what we need. Kube-prometheus-stack has created a bunch of default alerts for us (tunable in the helm chart), but let’s for example create alerts if WordPress is down or slow to respond:
kind: PrometheusRule
metadata:
  name: wordpress-rules
  namespace: grafana
  labels:
    release: kube-prometheus-stack
spec:
  groups:
  - name: wordpress.rules
    rules:
    - alert: WordPressSlowResponse
      expr: avg_over_time(probe_duration_seconds{job="wordpress-http"}[5m]) > 1
      for: 2m
      labels:
        severity: warning
        namespace: grafana
      annotations:
        summary: "WordPress response is slow"
        description: "Average response time over 5 minutes is more than 1 second."
    - alert: WordPressDown
      expr: probe_success{job="wordpress-http"} == 0
      for: 2m
      labels:
        severity: critical
        namespace: grafana
      annotations:
        summary: "WordPress is down"
        description: "No successful probe to WordPress for 2 minutes."
The label namespace: grafana on the alerts, I needed to get it sent to Slack. As I said, getting these labels correct can be a bit tricky. But anyhow, this will create a warning alert for slow response and critical alert for
You can also alert based on logs:
apiVersion: v1
kind: ConfigMap
metadata:
  name: loki-rules
  namespace: loki
  labels:
    loki_rule: "true"
    org_id: "fake"
    namespace: grafana
    severity: warning
data:
  sanoid-prune-rules.yaml: |
    groups:
      - name: sanoid-prune-alerts
        rules:
          - alert: SanoidPruneFinishedFrequently
            expr: |
              sum by (job) (
                count_over_time({job="system"} |= "Finished sanoid-prune.service"[1h])
              ) > 6
            for: 10s
            labels:
              severity: warning
              namespace: grafana
            annotations:
              summary: "Sanoid prune service finished frequently"
              description: "The message 'Finished sanoid-prune.service' appeared more than 2 times in the last hour in container {{ $labels.container }}."
This rule was based on a logs injected from outside Kubernetes, a job I’m no longer running. I currently don’t have any log rules, I feel metrics is enough for me for now. Basiclly it will count how many times sanoid was running and alert if it was more that specified. Since I label them namespace: grafana, the alerts will potentially be sent to my Slack monitoring channel.
Summary
Kubernetes and things made for Kubernetes usually expose a ton of metric. It’s possible to create dashboards to look at trends and visualize your platform. It can eat a bit of resources at times, though, and especially if your platform is already struggling (i.e you have done too much experimenting, like I tend to….), it’s often good to just turn off or scale down logging a bit until it’s stabilized.
You can also monitor logs – and last bot not least – create rules and alerting to make sure the platform itself send you messages when it’s not healthy!
Are we getting serious yet?